Annual Report & Accounts 2026
70
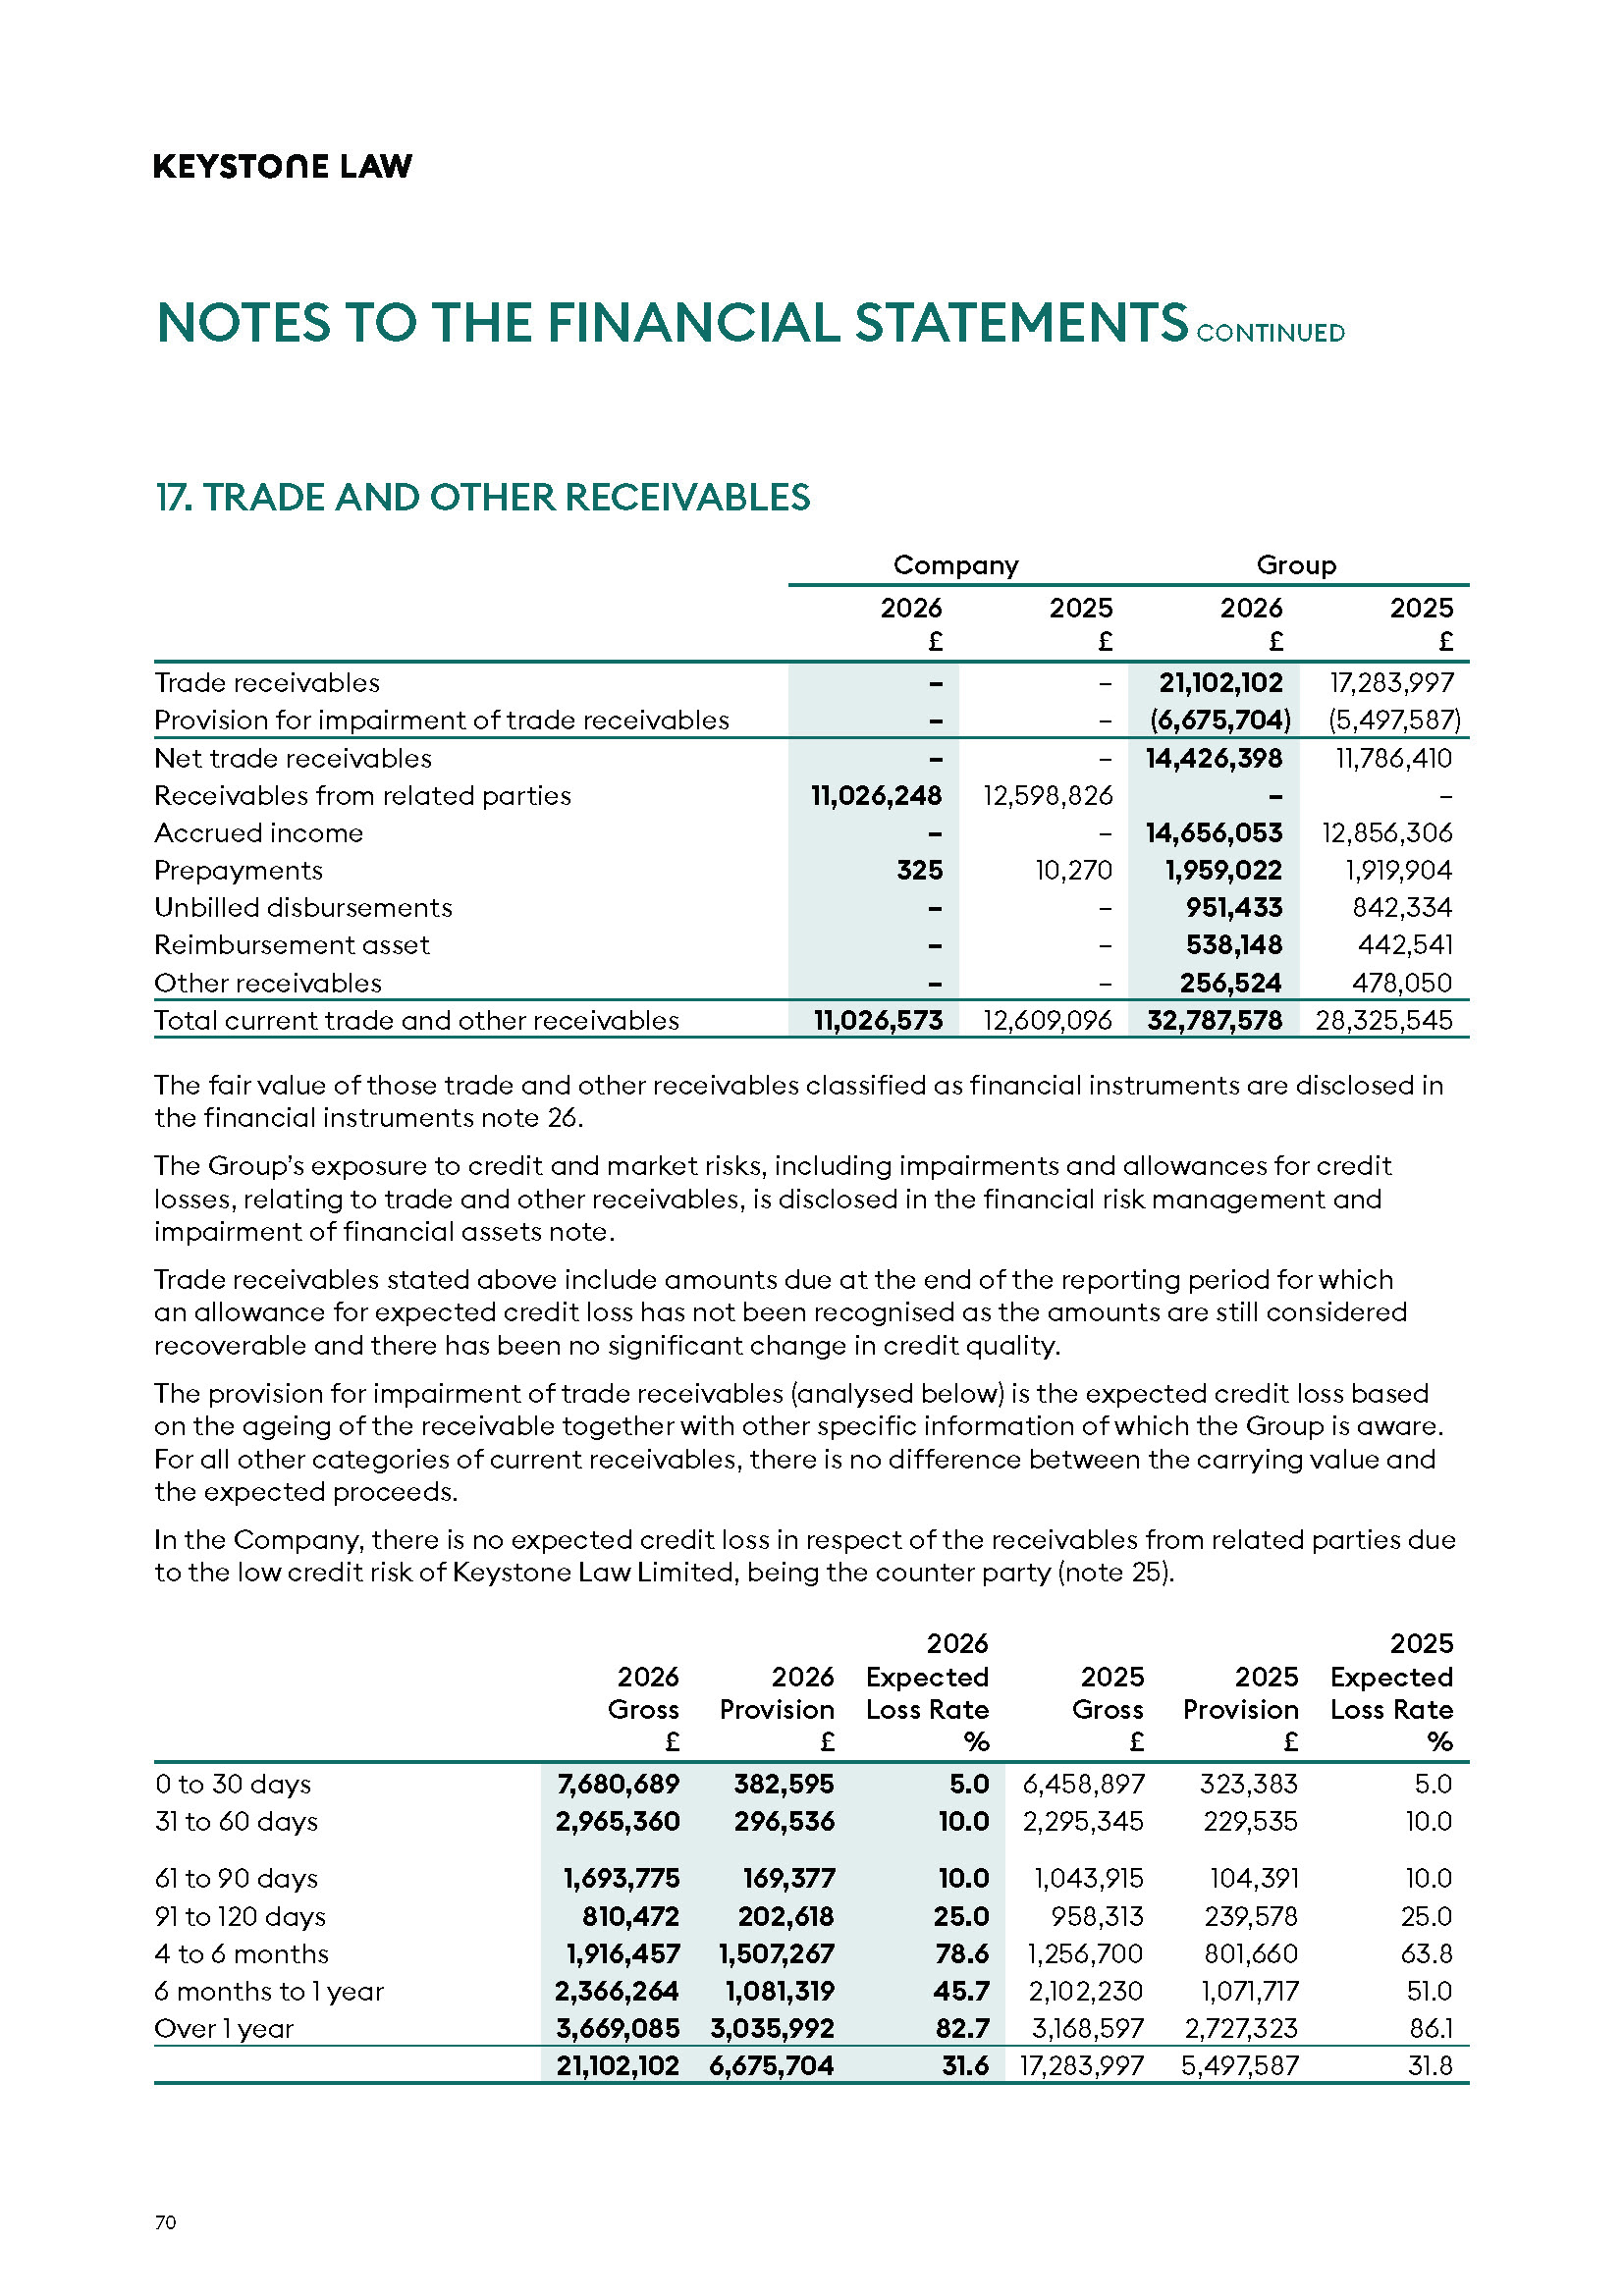
17. TRADE AND OTHER RECEIVABLES
Company
Group
2026 £ 2026 £ 2026 £ 2026 £ Trade receivables
–
–
21,102,102
17,283,997
Provision for impairment of trade receivables
–
–
(6,675,704)
(5,497,587)
Net trade receivables
–
–
14,426,398
11,786,410
Receivables from related parties
11,026,248
12,598,826
–
–
Accrued income
–
–
14,656,053
12,856,306
Prepayments
325
10,270
1,959,022
1,919,904
Unbilled disbursements
–
–
951,433
842,334
Reimbursement asset
–
–
538,148
442,541
Other receivables
–
–
256,524
478,050
Total current trade and other receivables
11,026,573
12,609,096
32,787,578
28,325,545
The fair value of those trade and other receivables classified as financial instruments are disclosed in the financial instruments note 26.
The Group’s exposure to credit and market risks, including impairments and allowances for credit losses, relating to trade and other receivables, is disclosed in the financial risk management and impairment of financial assets note.
Trade receivables stated above include amounts due at the end of the reporting period for which an allowance for expected credit loss has not been recognised as the amounts are still considered recoverable and there has been no significant change in credit quality.
The provision for impairment of trade receivables (analysed below) is the expected credit loss based on the ageing of the receivable together with other specific information of which the Group is aware. For all other categories of current receivables, there is no difference between the carrying value and the expected proceeds.
In the Company, there is no expected credit loss in respect of the receivables from related parties due to the low credit risk of Keystone Law Limited, being the counter party (note 25).
2026 Gross £ 2026 Provision £ 2026 Expected Loss Rate % 2026 Gross £ 2026 Provision £ 2026 Expected Loss Rate % 0 to 30 days
7,680,689
382,595
5.0
6,458,897
323,383
5.0
31 to 60 days
2,965,360
296,536
10.0
2,295,345
229,535
10.0
61 to 90 days
1,693,775
169,377
10.0
1,043,915
104,391
10.0
91 to 120 days
810,472
202,618
25.0
958,313
239,578
25.0
4 to 6 months
1,916,457
1,507,267
78.6
1,256,700
801,660
63.8
6 months to 1 year
2,366,264
1,081,319
45.7
2,102,230
1,071,717
51.0
Over 1 year
3,669,085
3,035,992
82.7
3,168,597
2,727,323
86.1
21,102,102
6,675,704
31.6
17,283,997
5,497,587
31.8
NOTES TO THE FINANCIAL STATEMENTS CONTINUED